IFS - First Online Film Festival
Statistical Results from the Online Film Festival
The official run of the festival was for 57 hours from 2pm CST, Friday, March 6 through 10pm, CDT Sunday, March 8. Plus, there was a one-hour preview beginning at 7pm CST, Thursday, March 5.
In that time, the festival attendees made 6,956 requests to view the films (on average, each film was viewed twice).
The geographic distribution of the visitors from the USA were as follows:
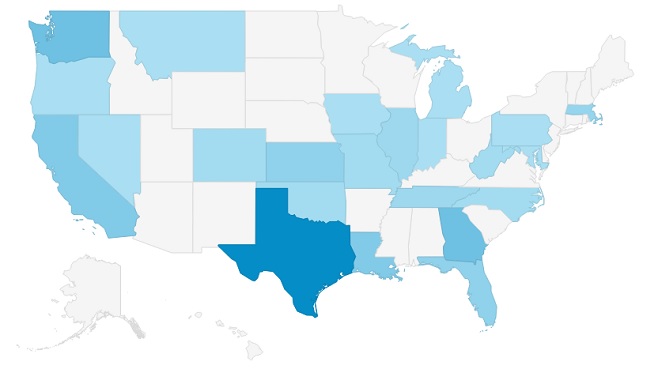
Internationally, we also served visitors from Canada, Norway, Spain, Poland, the Netherlands, Australia, Philippines, Malaysia, and Paraguay.
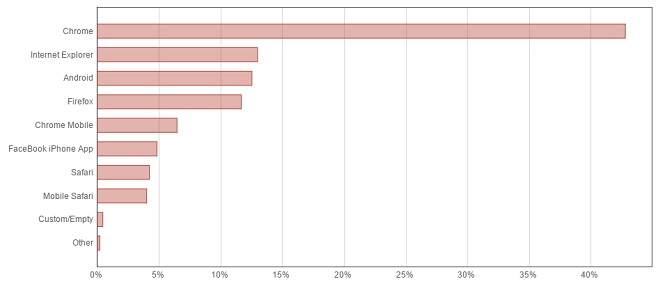
The technology used to view the films were:
The viewing requests were distributed over time as follows:
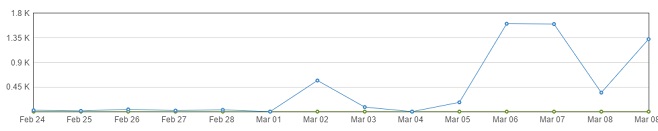
A couple of notes about the graph above: (1) The peak on March 2 was my personal internal testing as I mounted the films into the CDN and did extensive testing from my cross-browser lab to make sure we were ready for the festival. My internal testing continued through March 4. (2) Friday and Saturday were the big days, a little more on Sunday. The graph above is based on Universal Time (GMT) which is -6 hours from Dallas time. Therefore, some of the traffic showing on March 9 was actually from Sunday night Dallas time near the close of the festival at 10pm CDT.
The most often served speed from our Adaptive Stream file set was the 2,256-kbps version with the 1,332-kbps coming in second. Most surprising of the speed results was the number of people who watched the films at the full 1080p version of 8,884-kbps; it was our third most-viewed speed representing about 15% of the views.
Of all of the viewing requests, we successfully served 95.7% of all requests. Note that no technology can successfully serve all requests. There are simply some older devices (particularly mobile devices) that we don't support. Also, since about 25% of our traffic was from mobile devices, the connection speed of the requesting device had to support the slowest streaming speed we provided (356-kbps). Some of our viewing requests came in via 3G mobile connections and were not able to view the films, as a result, because their connection speed was inadequate. Overall, from obsolete devices and inadequate connection speeds, we still were able to keep the error rate to only 4.3% across the run of the festival thanks to the use of our new embedded player technology (that supports a broad range of devices and browsers) and our use of Adaptive Streaming across a wide range of speeds (that supports speed from 356-kbps to 11,000-kbps in eleven steps/versions.)
Graphically, the error rate for the run of the festival was:
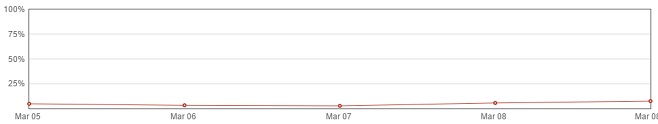
The low error rate is significant because we served the entire festival using HSL in an Adaptive Streaming configuration; including serving Android devices and Flash browsers from the HSL transport protocol (instead of our previous use of RTMP.) Being able to serve HSL to these devices through our embedded player is a very new technology and the festival was a test to see if this new technology was ready for "prime time." The technology passed this "trial by fire" with flying colors.
No platform will ever reach a 0% error because of bad mobile connections (under-performing cell sites do happen with some regularity) and there will always be a certain number of old obsolete mobile devices and browsers that people will still use. Based on my own rough calculations, I think we support 95% of all device/browser combination regardless of age and 99%+ of devices/browsers less than two years old. Over time, the 5% we don't support will attrite out of the device population as their users replace them with something newer or the devices die of the own accord due to age.
Our 95.7% success figure seems to support my assumptions. Considering bad mobile connections are included in this figure and perhaps were at least half of all errors, we perhaps (???) supported 97%+ of the devices/browsers used in this real-world test. Over the coming year, this figure should approach 99% as the older device attrite.
During the three weeks before the film festival (beginning February 17), we showed the festival promo video 830 times:
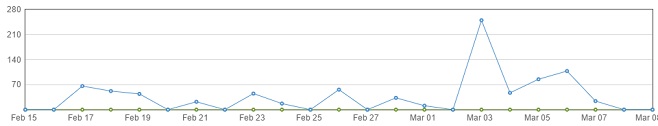
The promo averaged about 60 views per day from totally organic traffic resulting solely from the festival ad on TTC's home page. People saw the ad and clicked through to the festival's promotional landing page, and some percentage of them played the video. Then, starting the week of the festival, our social-media promotion and online advertising started on March 3 and produced the peak that you see in the graph. The 60-second promo video was served from our new media platform using our new embedded player. It served as an early "vanguard" test (or "trip wire," if we were to have a problem, the promo video would show it first) while we made sure the new platform was ready for the festival. The platform was ready, and the promo video was served without issue building our confidence that we were ready for the festival.
Festival's Films
Background of Films
From 'iil Acorns (2010) Background
Elephants Dream (2005) Background
Big Buck Bunny (2008) Background
Tears of Steel (2012) Background